4.2 million requests in 24 hours. Average response: 774 ms. Success rate: 99.91%. The same workload averaged 2.5 seconds for the seven days before our rebuild. That's a 70% drop in average response time, on the same hardware, against the same target sites, with the same proxy pool. We rebuilt the parts of the request path that were quietly costing customers their evenings.
This is a write-up of what changed, what the numbers actually look like, and where Single and Proxy Finder differ for a reason.
A note on the data first. The numbers in this post are from production traffic, with one specific target host excluded. That host has been actively rate-limiting and challenging requests all week, and it skews every metric you look at. Include it and success drops to about 95%. But that 5% gap isn't our infrastructure failing. It's one site refusing requests, regardless of how good our picker is. We pulled it out so you can see what the system actually does on cooperative targets.
What the data shows
Here's the daily average across our production traffic for the last week:
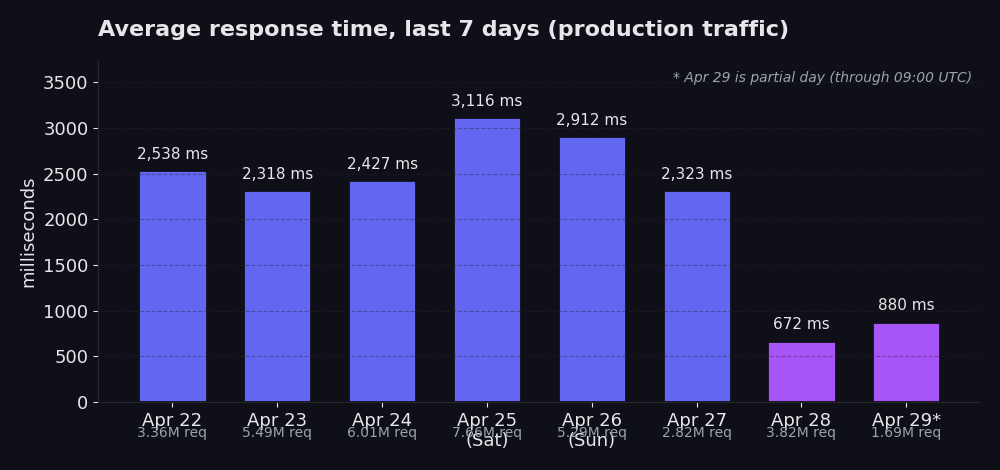
Apr 22 through Apr 27: averages between 2,318 ms and 3,116 ms, traffic between 2.8M and 7.7M requests per day. Apr 25 stands out at 3,116 ms across 7.7M requests, which is the Saturday peak (weekend volume runs noticeably higher and pushes the average up). Apr 28: 672 ms across 3.8M requests. Apr 29 (partial day, through 09:00 UTC): 880 ms across 1.7M requests so far.
Same architecture. Same proxies. Same target sites. Different request path.
The percentile picture is sharper than the average. Averages can hide bad tails. Percentiles can't.
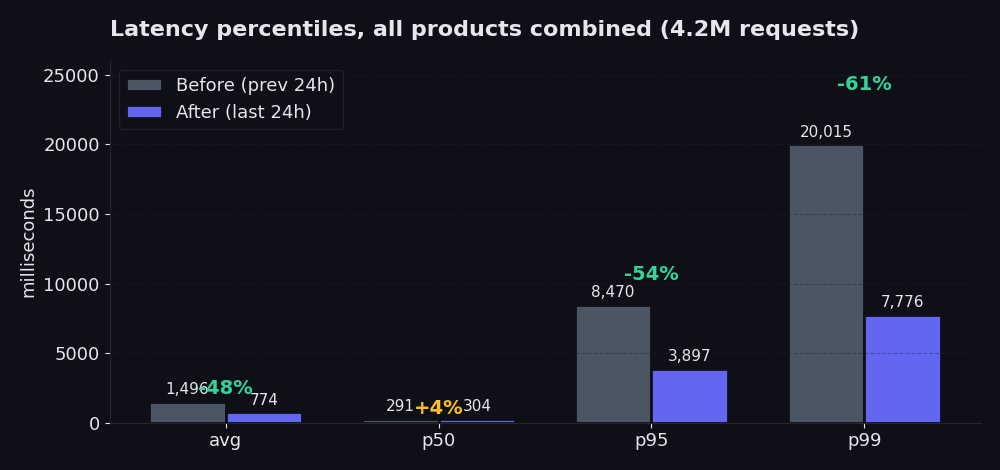
The chart compares the 24 hours after our rebuild against the 24 hours before. p50 barely moved (and ticked up 4%, which is honest data; the fast path was already fine and the new picker spends a little more effort up front to save a lot at the tail). Average dropped 48% in that window. p95 went from 8.5 seconds to 3.9 seconds, a 54% cut. p99 went from 20 seconds to 7.8 seconds, a 61% cut. That's where the pain lives, and that's what you actually feel when your scraper is waiting on the slowest 5% of requests to come back. Compared against the seven days before the rebuild (where average held around 2.5 seconds), today's 774 ms average is a 70% drop.
Success rate climbed too: from 98.85% to 99.91% over the same window. On Proxy Finder specifically, the rate hit 99.89%. On Single, 99.96%. That's the number we're proudest of, because it tells you how often we hand back useful data on the first attempt without having to retry.
Two products, two latency profiles
We don't compare Single and Proxy Finder against each other. They solve different problems and they have different latency budgets. If you're using one and looking at the other's number, you're reading the wrong scoreboard.
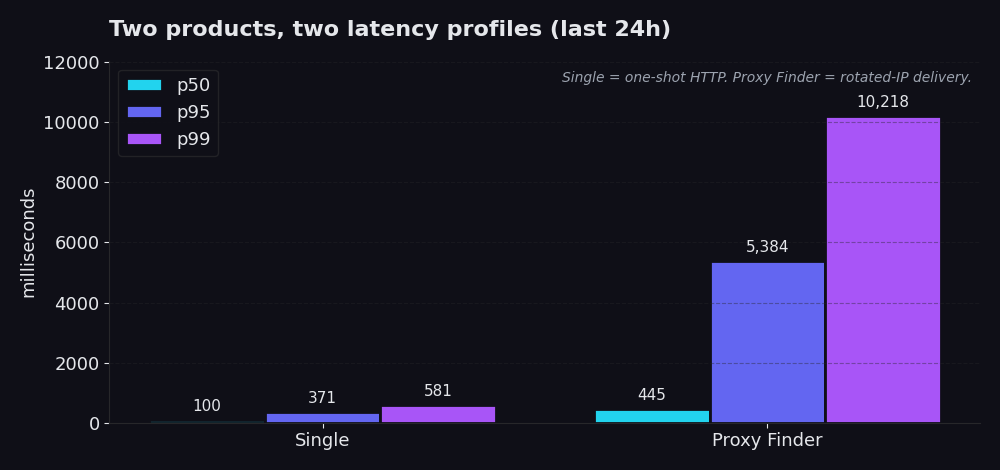
Single is a one-shot HTTP request through our infrastructure. You give us a URL and, in roughly 99% of real production calls, a proxy id you already know works. We fetch the URL through that proxy, you get the response. No rotation logic, no retry cascade, no proxy churn. Last 24 hours: p50 of 100 ms, p95 of 371 ms, p99 of 581 ms. Most calls finish in under a fifth of a second. Even the worst 1% comes back in under 600 ms.
Proxy Finder is the discovery layer. It rotates your request across a pool of public proxies, validates each candidate, retries on failure, and hands back the first response that actually worked, plus the id of the proxy that did it. p50 of 445 ms, p95 of 5.4 seconds, p99 of 10.2 seconds. Slower because it has to be. The whole point is that the IP your scraper hits the target site with is rotated, throwaway, and disposable. You're trading a few seconds of overhead for resilience against block lists and rate limits.
The reason Single is so fast isn't magic. It's that Single trusts something Proxy Finder had to discover. When you call Proxy Finder once and it returns "this proxy worked, here's its id," subsequent fetches against the same target through Single skip the entire discovery step. You go straight to the proxy that already passed validation.
How teams use them together
Most teams hitting a target frequently follow a two-step pattern. The first call is exploratory; the rest are committed.
The first call goes to Proxy Finder. It rotates through the pool, validates each candidate against your accept rules, and returns the response along with the id of the proxy that worked. That id is your handle for any future call that wants to hit the same target.
Every call after that goes to Single, with the proxy id attached. No discovery, no validation, no retry cascade. We route your request through the proxy you specified and stream the response back. That's the path that hits 100 ms at p50.
When the proxy that worked yesterday gets blocked today, you fall back to Proxy Finder for one call to re-discover, then resume Single fetches with the new id. We don't paper over staleness. If a proxy id you handed us is dead, we tell you fast so you can rotate.
The 99/1 split (Single dominant in volume, Proxy Finder dominant in discovery) is why our Single numbers look the way they do. It's not that Single is intrinsically a faster product. It's that Single is the steady state and Proxy Finder is the calibration step. Most workloads are mostly steady state.
If your job is "fetch this JSON from a clean public API that doesn't care who's calling," skip the proxy entirely and use Single on its own. If your job is "hit this protected page from a pool of disposable IPs without getting flagged," compose them. They're not alternatives. They're stages of the same workflow.
What we changed
Most of the win came from rebuilding three things in the proxy rotation path. None of them were new ideas. They were just things we'd been deferring.
The pool stopped trusting bad data. Before the rebuild, the proxy directory kept entries around longer than it should have. Some of those entries weren't reachable anymore. Picking one of them meant you spent 15 to 30 seconds finding out the hard way. We moved to a model where the pool reflects what's actually alive in near real-time, and the picker prefers IPs we've recently seen succeed.
Quality scores per proxy, not just up-or-down. Before, a proxy that took 5 seconds to respond looked the same as one that took 300 ms, as long as both eventually succeeded. Now the picker tracks latency too. Slow-but-working proxies get pushed down the queue. Fast ones get reused while they're hot. This matters more than it sounds, because the long tail of the latency distribution is mostly slow-but-working proxies that the old picker kept choosing.
Per-target quality scores. A proxy that's reliable on one domain may be flaky on another. The IPs that work cleanly against one site get blocked or rate-limited on another. Our picker now tracks success and latency per target host, not just globally. When you ask for a fetch against a specific domain, we choose from the proxies that have actually performed well on that domain recently. Globally-good proxies stay in the running, but a proxy with a strong track record on the exact target outranks one with a strong track record overall.
Smarter retry escalation. When a request fails, we used to fan out parallel attempts immediately. That was wasteful, and worse, a single bad proxy could trigger a cascade of follow-ups that all failed in turn. Now retries escalate sequentially with short backoffs between attempts, so a fail is a fail and a retry is a retry, not a multiplier.
There's a second category of changes worth naming, even though it's less visible to you.
Restart resilience. Previously, redeploying any of our request infrastructure meant a 5 to 15 minute window where the proxy quality-score map had to rebuild itself from scratch. During that window, the picker is essentially guessing. Customers saw it as a latency spike right after every deploy. We now persist that quality map across restarts. The system comes up warm. As of today, we can deploy infrastructure changes mid-day without giving you a latency spike. The restart test we ran this morning showed a 15-second connection blip and zero recovery time afterwards. That's a quiet but meaningful change in our deploy cadence: we no longer have to schedule redeploys around your traffic.
Cleaner failure signals. When something inside our infrastructure goes wrong, your retry logic now gets the right HTTP status code to act on. A backend that's briefly unavailable returns a 503. A backend that returned malformed JSON returns a 502. A genuine internal error returns a 500. Before, all three looked like 500s, which meant your retry logic couldn't tell "wait and try again" from "this is broken, escalate." Now it can.
What this looks like for you
If you're running scrapers against rotated proxies, the practical change is that your p95 and p99 are each cut roughly in half from a week ago. Average request time goes down. Retries due to slow-but-eventually-working proxies go down. Tail latency, which is what makes a 1,000-request job take an hour instead of 20 minutes, drops with it.
If you're running Single, you'll see the picker work pay off mostly at the tail. p99 dropped to under 600 ms, which means even your unlucky 1% of requests now comes back fast. Single was already quick. It's now consistent.
Honest limitations
We didn't fix everything. A few specifics that still apply:
Proxy Finder p99 is still around 10 seconds. We cut it in half, but the long tail is real. Some of that is on us (pool depth, picker noise on rare targets). A lot of it isn't: target sites can be slow on their own, can rate-limit specific routes, can serve challenge pages that take time to inspect, or can simply timeout. Our infrastructure can pick the best available IP, but it can't speed up a target server that's deciding whether to answer. If your job depends on every request returning in under 5 seconds, set a per-request timeout that matches your tolerance and trust the retry layer.
Some targets are hostile, and that shows up in your numbers. As mentioned at the top, the 99.91% success rate excludes one host that's actively challenging us this week. Including it drops the rate to about 95%. That host isn't unique. Any aggregator working with public-web data sees this. The target shifts week to week. The picker rebuild gives the system a much better shot at routing around hostile targets, but it can't override a site that's decided to refuse traffic outright. Our job is to give you the cleanest possible data on the cooperative cases and to fail fast on the hostile ones.
Same-day comparison has noise. The 24-hour window we're showing in the percentile chart compares yesterday to the day before. Day-of-week effects, target-site variance, and pool composition all shift between any two windows. We're confident in the direction (the 7-day chart shows a clean inflection point on Apr 28), but if you bench us against your own workload, run the comparison over at least a week.
What's next
The picker rewrite is the foundation. A few things we have queued behind it:
A shared quality-score map across instances, so they learn from each other instead of building independent maps. Right now they each carry their own picture of which proxies are good. That works, but it's wasteful: every instance pays the same learning cost in parallel.
Confidence-based picking, where we prefer proxies we've actually tested in the last few minutes over ones we're guessing about. Useful for low-volume customers whose traffic doesn't keep the picker warm on its own.
And longer-horizon: pushing more decisions into the picker so the per-target quality score becomes one signal among many (target latency profile, time-of-day patterns, pool segment health). The infrastructure now exists to do this without slowing the hot path down.
The cheapest request is the one we didn't have to retry. The picker rebuild is the bet that better data at the moment of choosing beats more attempts after the fact. The first 24 hours of evidence say it's the right bet.